Information Design · Editorial Design · Adobe Illustrator
Fashion Through The Decades.
Exploring fashion history through the cultural icons who defined each era.
The Collection · Three editorial infographics, one visual language
01 · The Challenge
Turning research into visual storytelling.
Create a series of editorial infographics that communicate the defining fashion trends of different decades through influential female cultural icons. The project focused on translating historical research into visually engaging and accessible information design.
02 · The Concept
Fashion through its icons.
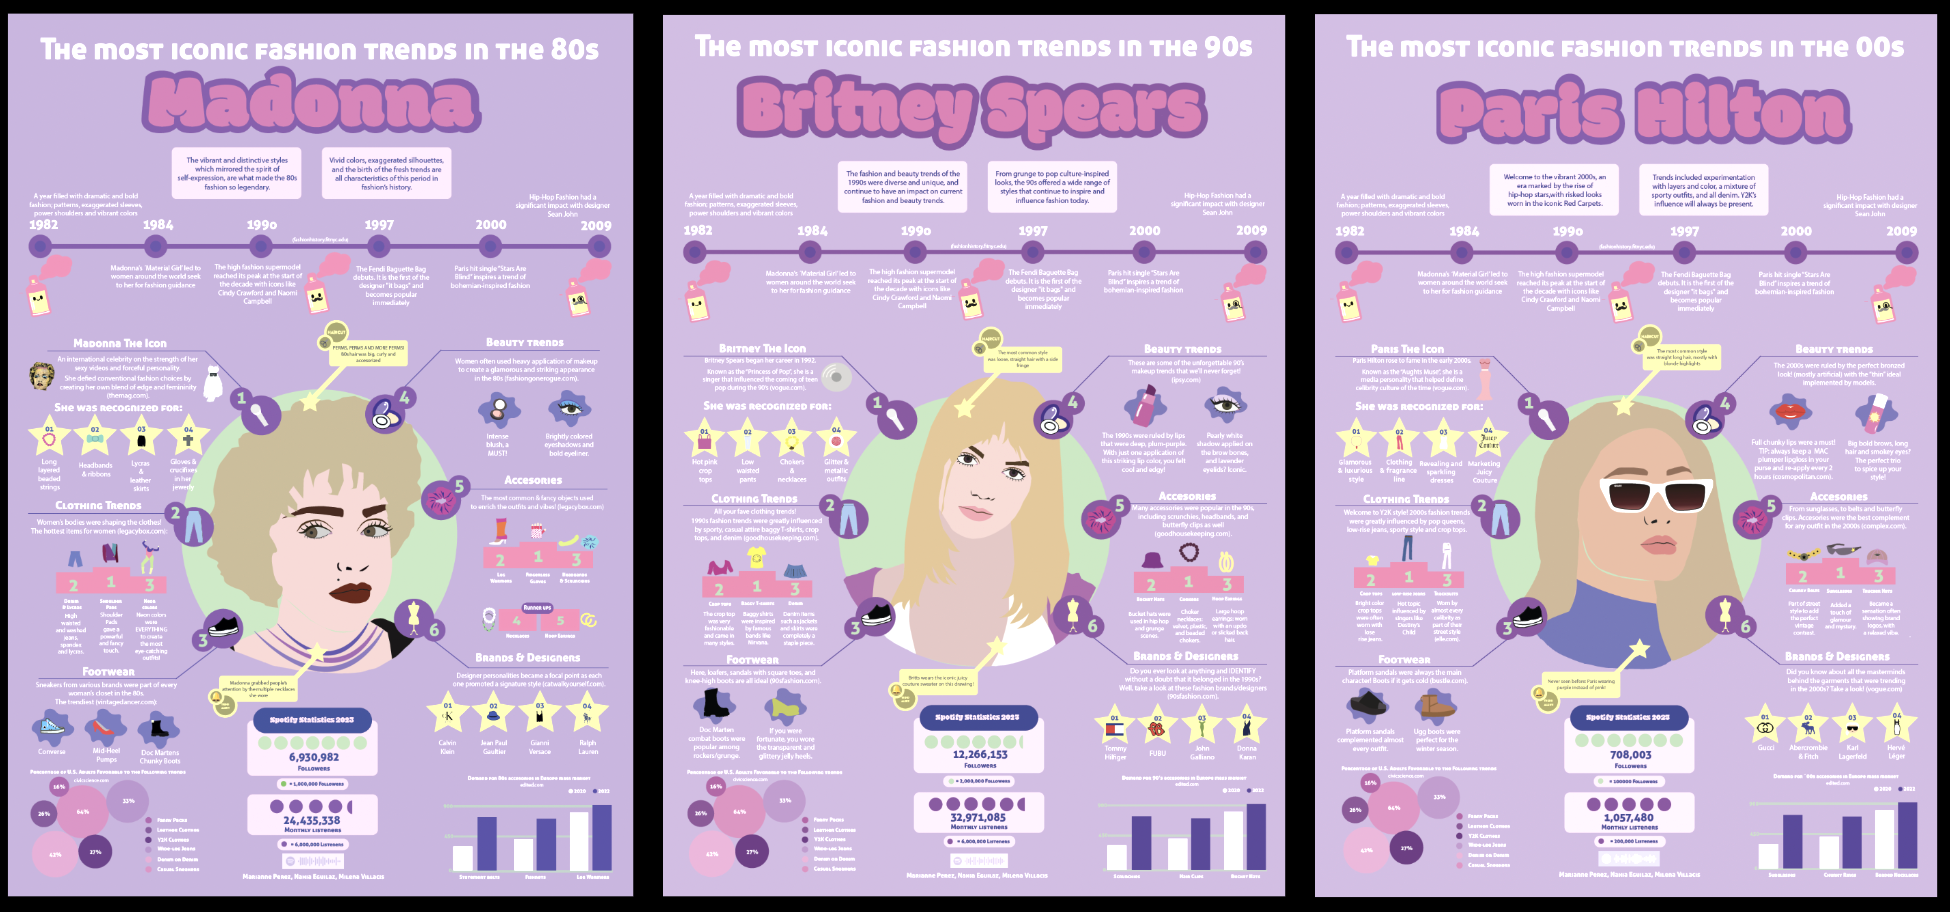
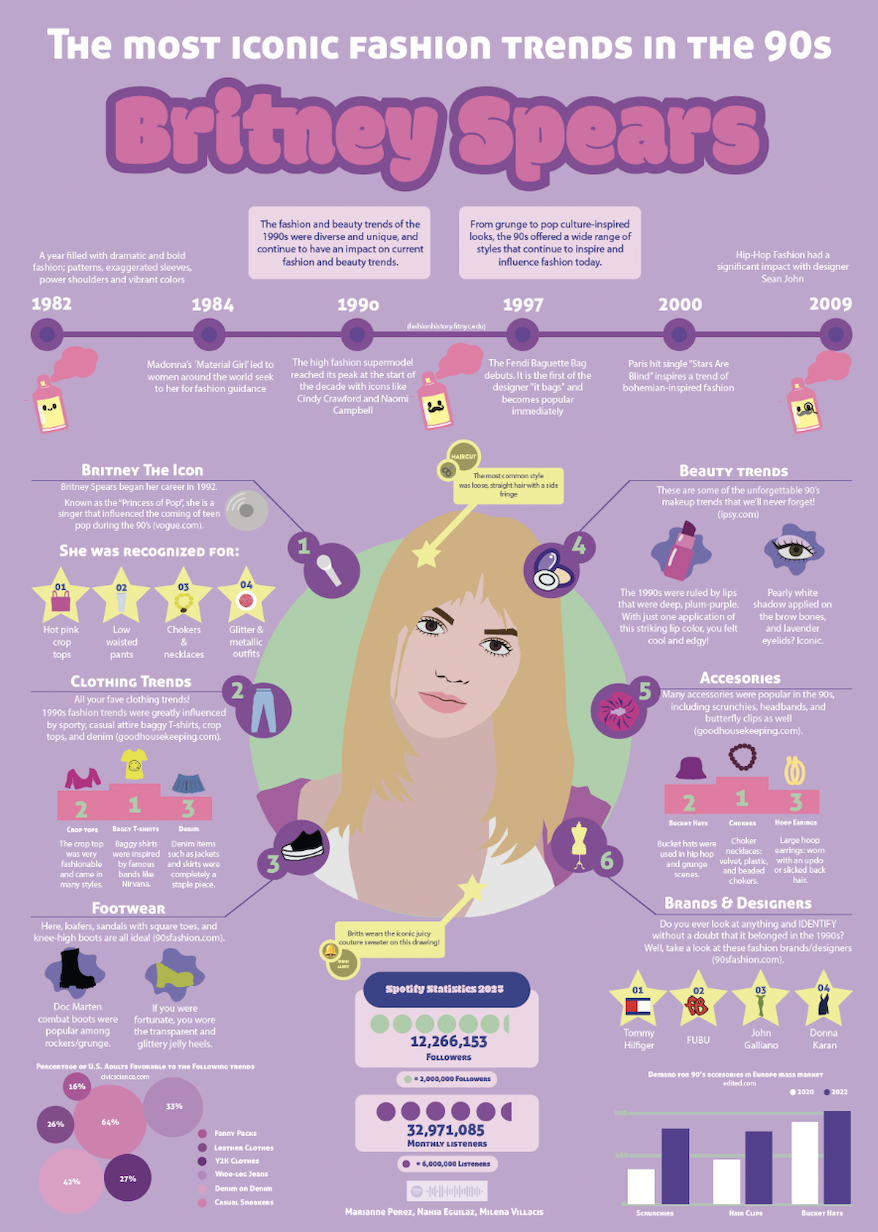
Rather than presenting fashion history as a timeline alone, the project explored how individual celebrities became symbols of their respective eras — Madonna for the 1980s, Britney Spears for the 1990s, Paris Hilton for the 2000s. Each infographic combined trends, beauty standards, accessories, footwear, designers, and cultural references into a single visual narrative.
03 · Process
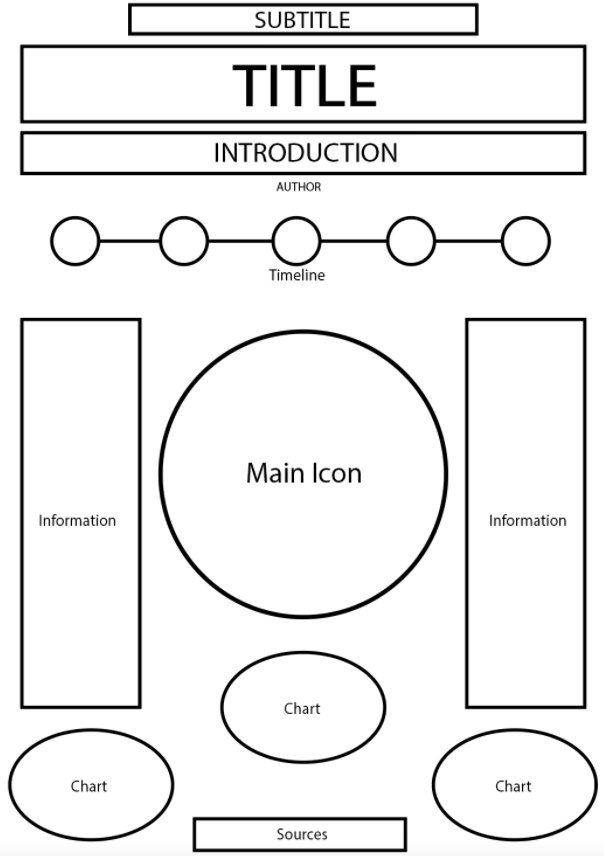
From wireframe to final design.
The project began with a structural wireframe designed to organise information, hierarchy, visual flow, and data visualisation. That framework evolved into three fully illustrated editorial infographics developed in Adobe Illustrator.
04 · The Collection
Three decades, three icons.
Click any infographic to zoom in and explore the details — typography, illustrations, statistics, and the small editorial decisions that tie each era together.
1980s
Madonna
1990s
Britney Spears
2000s
Paris Hilton
05 · Design Approach
Editorial storytelling through data.
The visual language was inspired by magazine covers and pop culture publications from each era.
Typography, color palettes, illustrations, icons, timelines, and statistics were combined to create infographic designs that felt both informative and culturally relevant.
06 · What I Learned
Research, rendered as design.
This project strengthened my Adobe Illustrator skills and deepened my understanding of editorial design, information hierarchy, and visual storytelling.
It demonstrated how complex research can be transformed into engaging visual experiences that communicate information clearly while maintaining a strong creative identity.
Software
Adobe Illustrator
Focus Areas
Information Design · Editorial Design · Data Visualisation · Visual Storytelling
Next project — 08